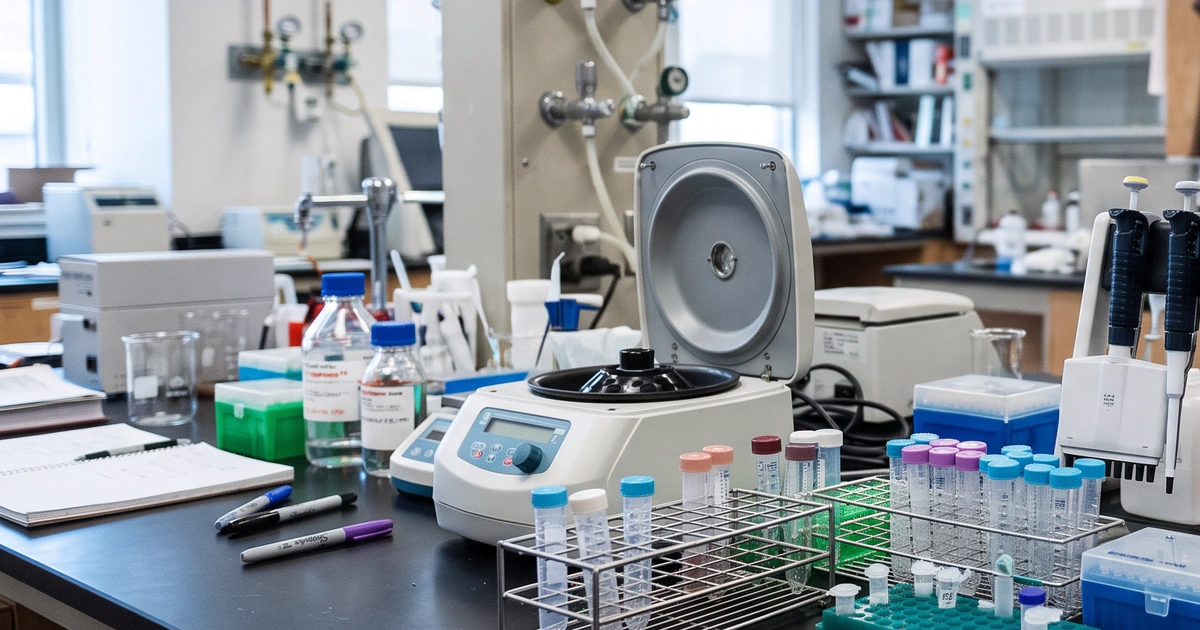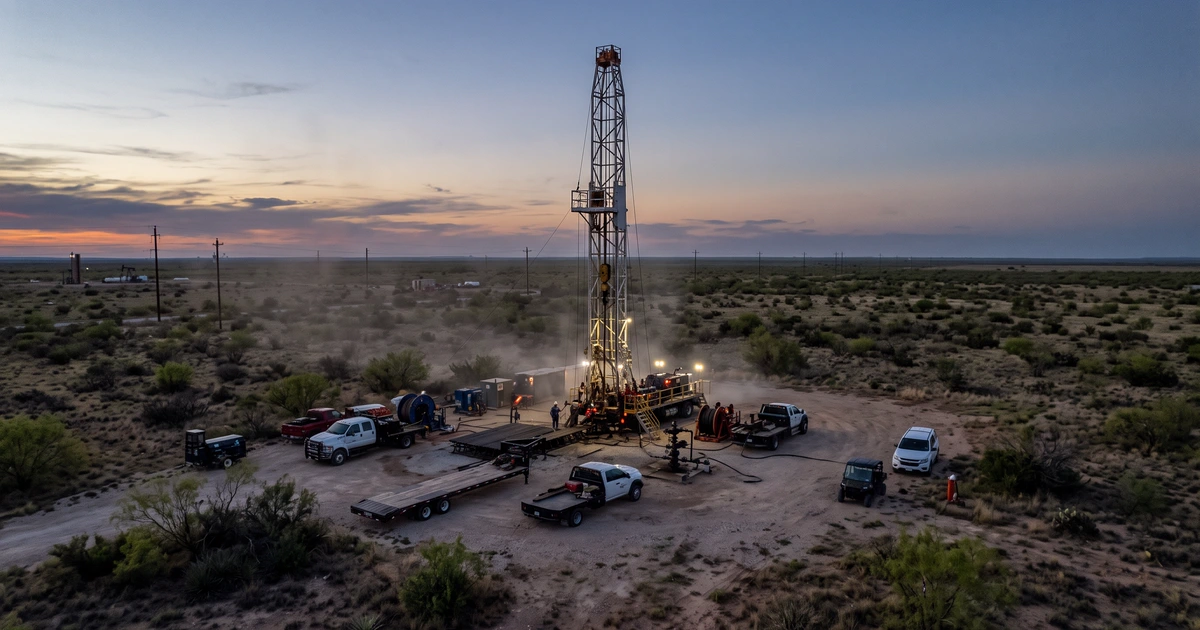
Oilfield service companies sell rigs, sand, compression and lab work to the producers that drill and operate wells. Their revenue follows producer spending, and their equipment is expensive, so the balance sheet often decides who comes through a slowdown. The Desk looked at four liquid US listed names in the space with market values between $200 million and $500 million, using their June quarter 10-Q filings.
June Quarter 2026 at a Glance
| Company | Market cap | Q2 revenue | Change | Cash | Debt |
|---|---|---|---|---|---|
| Smart Sand (SND) | $217.1M | $115.1M | +34.1% | $10.2M | $16.4M |
| Ranger Energy (RNGR) | $348.5M | $176.5M | +25.5% | $4.2M | $13.7M revolver |
| Natural Gas Services (NGS) | $400.4M | $51.4M | +24.2% | $0.1M | $328.0M credit line |
| Core Laboratories (CLB) | $465.7M | $124.6M | −4.3% | $22.7M | $116.4M |
Price data as of: October 19, 2026 close (stockanalysis.com): SND $5.12, RNGR $14.89, NGS $31.04, CLB $10.15. Balance sheet data as of: June 30, 2026. Market cap is closing price multiplied by shares on each 10-Q cover (SND 42,399,061; RNGR 23,402,023; NGS 12,898,285; CLB 45,884,542) and is Desk arithmetic, as are the revenue change rates.
Source: Smart Sand Form 10-Q filed August 11, 2026; Ranger Energy Services Form 10-Q filed July 28, 2026; Natural Gas Services Group Form 10-Q filed August 10, 2026; Core Laboratories Form 10-Q filed July 30, 2026. All for the quarter ended June 30, 2026.
A Small Cap, Not a Microcap
Ranger, Natural Gas Services and Core Laboratories each sit between $300 million and $500 million in market value. That is inside the Desk's $500 million ceiling but above the $300 million line FINRA and the SEC use. The Desk covers that band and labels it for what it is: these three are small caps. Smart Sand, at $217.1 million, is a microcap.
Smart Sand: Growth With Little Debt
Smart Sand describes itself as a fully integrated frac and industrial sand supply and services company. June quarter revenue rose 34.1% to $115.1 million, and operating income was $10.1 million against a small loss a year earlier. Net income was $10.2 million. It ended June with $10.2 million of cash and $16.4 million of debt, generated $6.5 million of operating cash in the half and spent $1.4 million on buybacks.
Source: Smart Sand Form 10-Q for the quarter ended June 30, 2026 (Item 1; Item 2; statements of cash flows).
Ranger: Growing by Acquisition, Funded on the Revolver
Ranger runs well service rigs, wireline and processing services. June quarter revenue rose 25.5% to $176.5 million. Rig hours rose to 146,800 from 117,000, which the company linked to its earlier AWS acquisition, and the hourly rig rate rose to $772 from $738. Net income was $6.9 million against $7.3 million. Ranger had $4.2 million of cash and $13.7 million drawn on its Wells Fargo revolver at June 30.
It has kept buying. On October 8, Ranger closed the purchase of STEP Energy Services' US coiled tubing, fluid and nitrogen pumping assets for about $27.5 million: $22.5 million in cash, borrowed on the same revolver, and 307,503 Class A shares valued at $5.0 million.
Source: Ranger Energy Services Form 10-Q for the quarter ended June 30, 2026 (Item 2; Note on debt); Form 8-K filed October 9, 2026 (Item 2.01).
Natural Gas Services: Growth on a $328 Million Credit Line
Natural Gas Services provides natural gas and electric compression equipment and services, much of it rented to producers. June quarter revenue rose 24.2% to $51.4 million, and the company said rental revenue rose on more rented horsepower and units. Operating income was flat at $9.9 million, and net income fell to $3.8 million from $5.2 million.
Compression fleets are capital heavy. Natural Gas Services spent $34.0 million on equipment in the first half, against operating cash flow of $48.5 million, and had $328.0 million drawn on its line of credit at June 30, with $84,000 of cash. Of the four names here, it carries the most borrowing relative to its size.
Source: Natural Gas Services Group Form 10-Q for the quarter ended June 30, 2026 (Item 1; Item 2; balance sheet; statements of cash flows).
Core Laboratories: The One That Shrank
Core Laboratories provides laboratory based analytical and field services that characterize crude oil and related products. June quarter revenue fell 4.3% to $124.6 million, which the company tied to lower international activity, partly offset by more work in the US. Net income fell to $6.0 million from $10.6 million. It carried $116.4 million of debt and $22.7 million of cash at June 30, and spent $6.7 million on buybacks in the half. It is scheduled to report third quarter results on October 28.
Source: Core Laboratories Form 10-Q for the quarter ended June 30, 2026 (Item 1; Item 2; statements of cash flows). Earnings date: stockanalysis.com.
Risks
- Producer spending. All four depend on oil and gas producers' budgets, which can be cut quickly when commodity prices fall.
- Leverage. Natural Gas Services' $328.0 million credit line and Ranger's revolver funded acquisition leave less room if activity slows.
- Integration. Ranger is folding in the STEP assets on top of its earlier AWS acquisition.
- International exposure. Core Laboratories' decline came from markets outside the US.
- Against the neutral read. Three of the four grew June quarter revenue by more than 20% from a year earlier, and Smart Sand turned an operating loss into a $10.1 million operating profit.
The Desk's Read: Neutral
The June quarter was a growth quarter for most of this group. The difference is in how that growth is financed: Smart Sand mostly from its own cash flow, Ranger and Natural Gas Services with borrowed money. The third quarter reports, starting with Core Laboratories on October 28, will show whether the growth held.
Sources
- Smart Sand, Form 10-Q for the quarter ended June 30, 2026, filed August 11, 2026
- Ranger Energy Services, Form 10-Q for the quarter ended June 30, 2026, filed July 28, 2026, and Form 8-K filed October 9, 2026
- Natural Gas Services Group, Form 10-Q for the quarter ended June 30, 2026, filed August 10, 2026
- Core Laboratories, Form 10-Q for the quarter ended June 30, 2026, filed July 30, 2026
- stockanalysis.com, SND, RNGR, NGS and CLB overview pages, close of October 19, 2026
Disclosure
This article is independent editorial content and reflects the author's opinion and analysis as of the date of publication. It is not investment advice and should not be relied on as the basis for any investment decision. MicroCap Desk and its contributors received no compensation of any kind — cash, securities, or otherwise — from any company mentioned, or from any third party, in connection with this article. The author holds no position in any security mentioned. Information is drawn from sources believed reliable but is not guaranteed accurate or complete. Microcap securities carry a high risk of loss. Do your own research. See our full Disclosure.